Why the project was needed
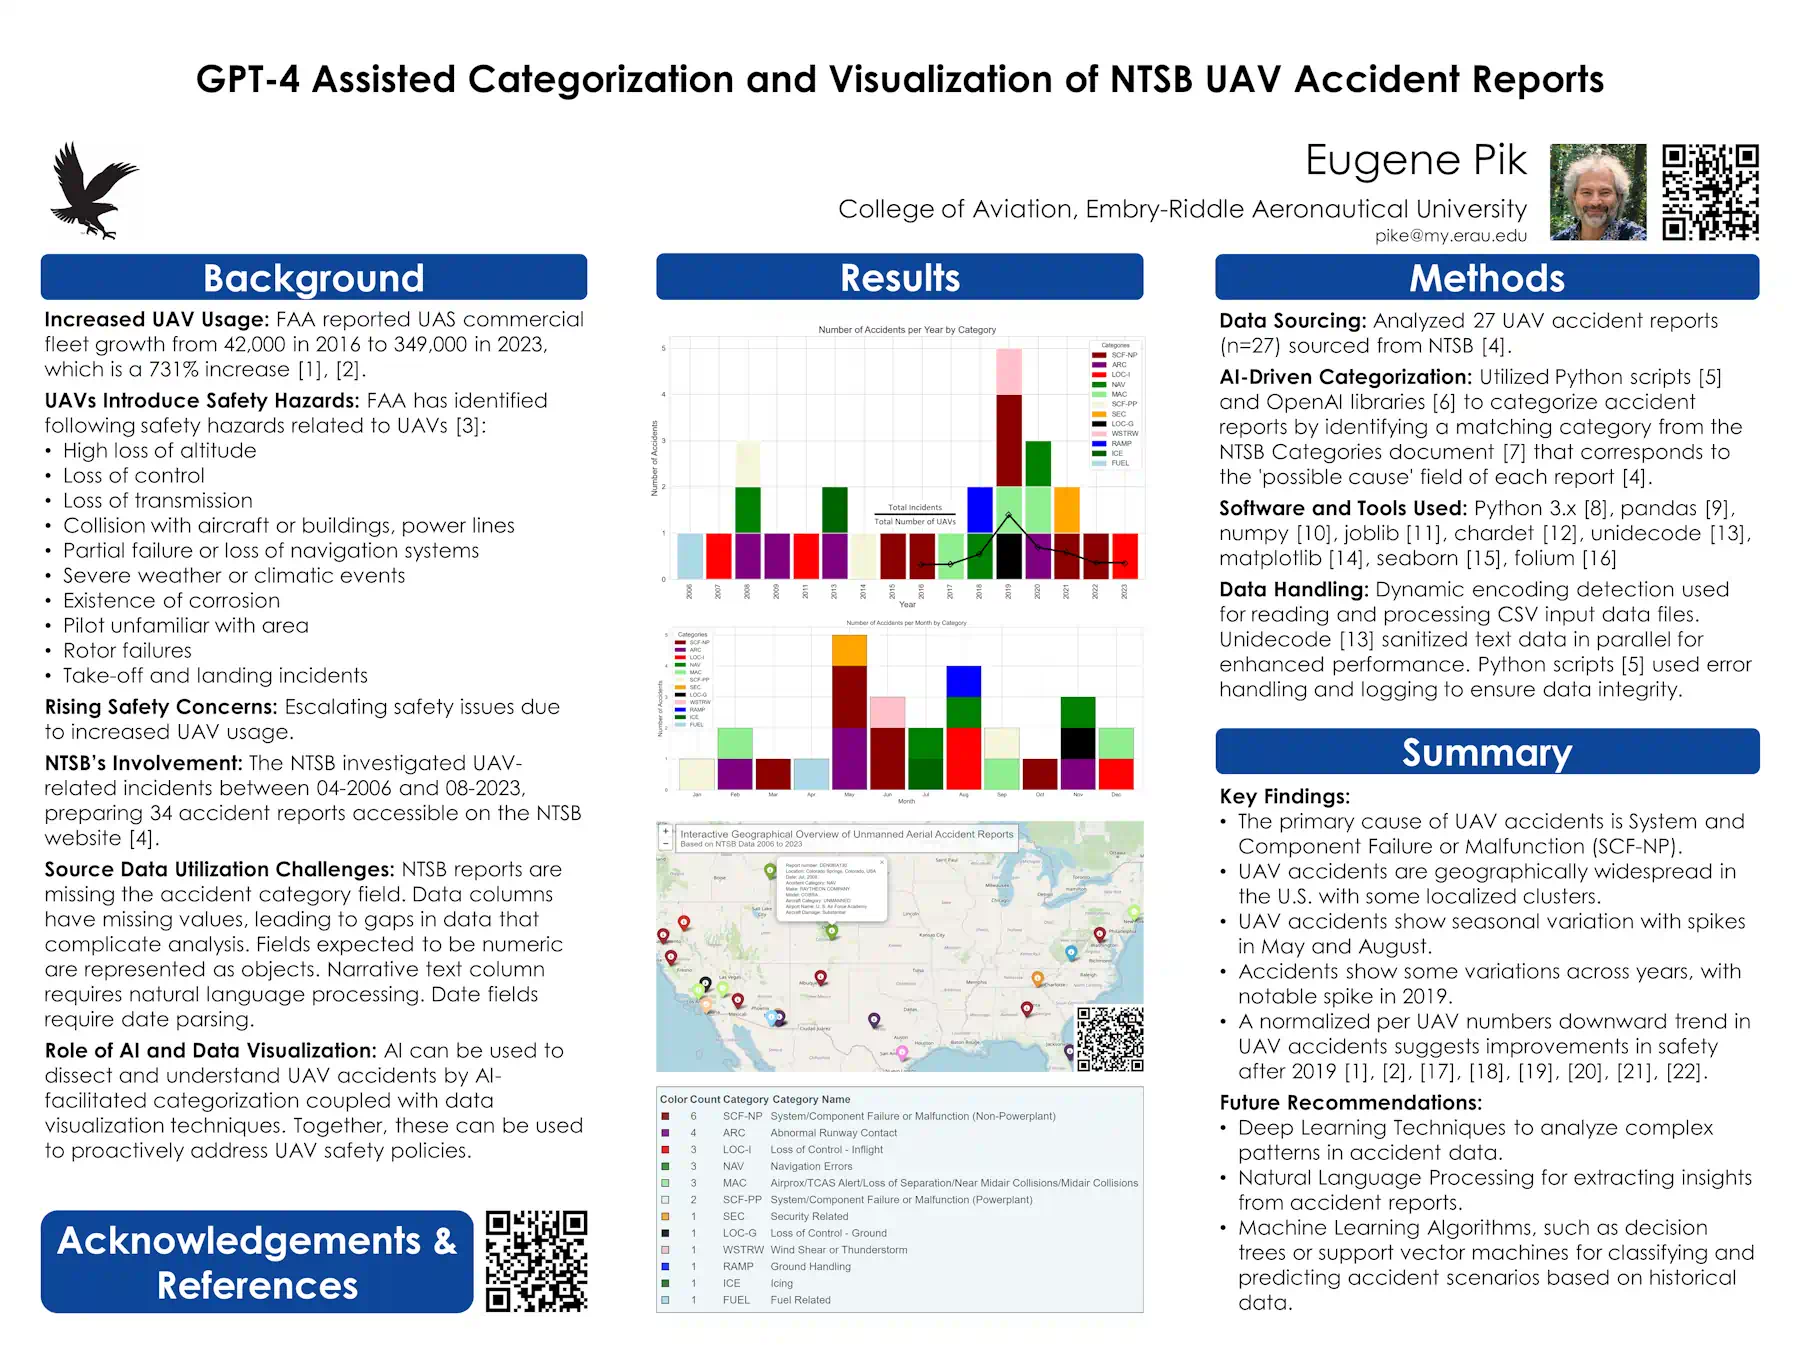
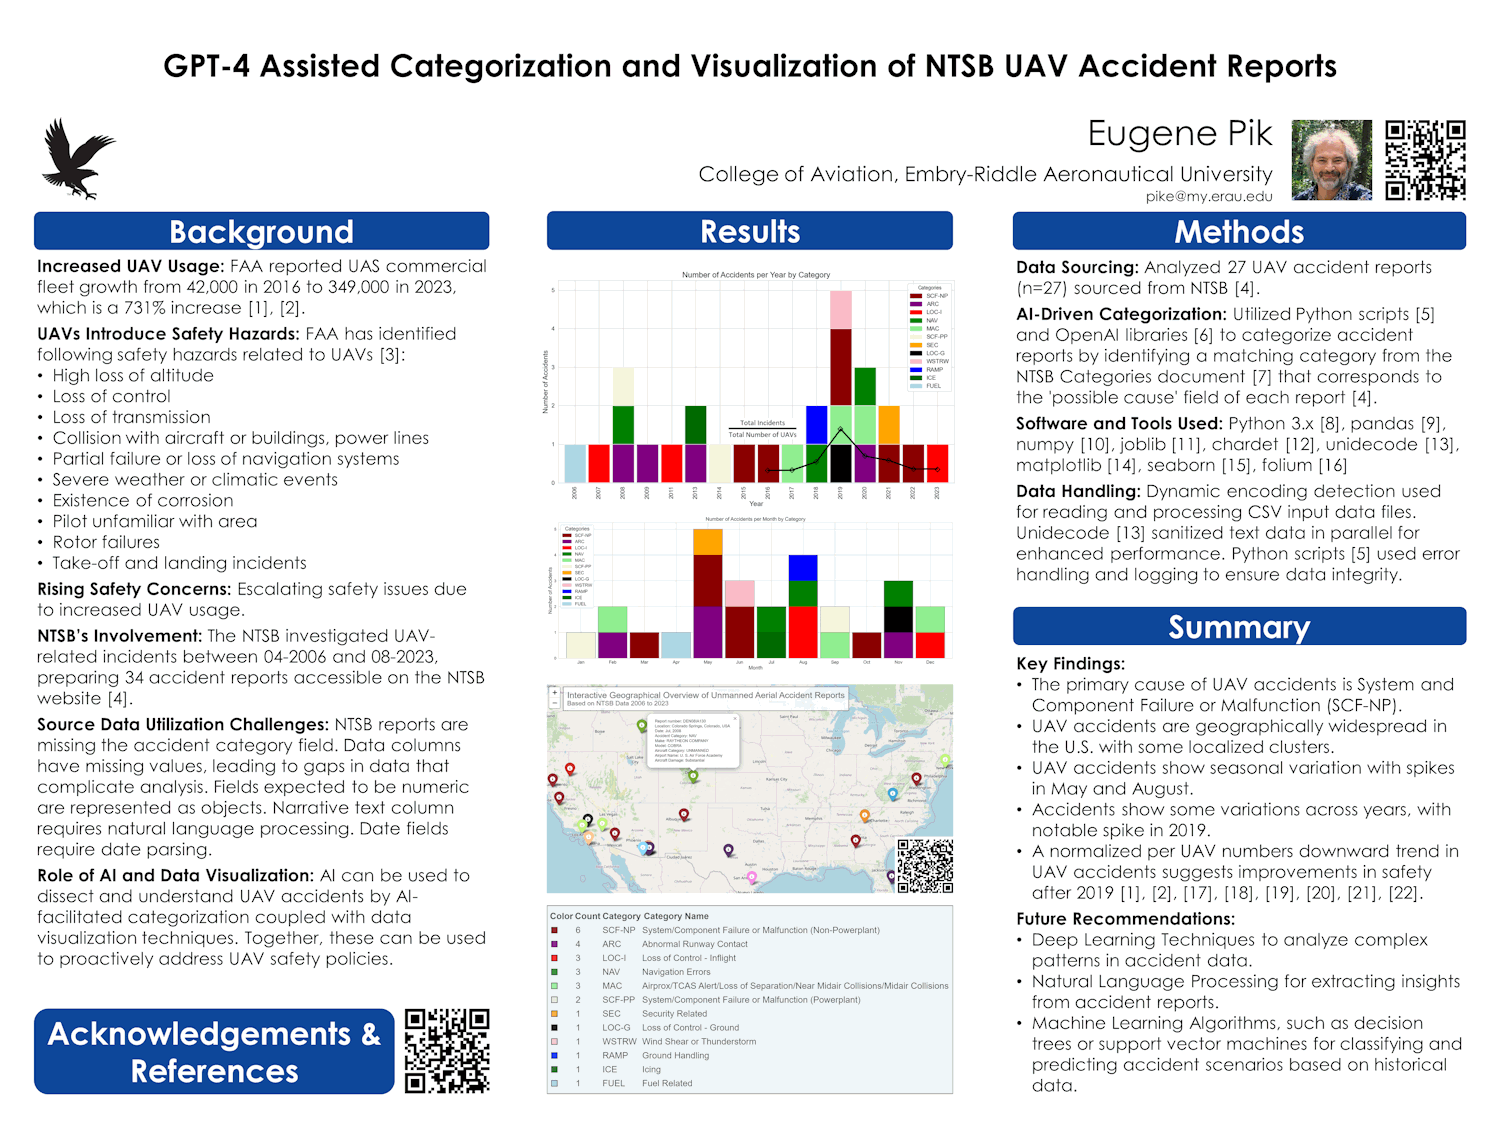
The FAA's commercial UAS fleet grew from about 42,000 aircraft in 2016 to about 349,000 in 2023, a 731% increase [1], [2], and the agency has identified a consistent set of hazards for unmanned operations: high loss of altitude, loss of control, loss of the command link, collision with aircraft, buildings or power lines, partial failure or loss of navigation systems, severe weather, corrosion, pilots unfamiliar with the area, rotor failures, and take-off and landing incidents [3].
The NTSB investigated a small number of these events between April 2006 and August 2023; a search of its public database returned 34 unmanned-aircraft reports, of which 27 were retained for analysis [4]. The reports are hard to use as data. There is no occurrence-category field, many fields are empty, numeric columns are stored as text, the useful information sits in a free-text narrative, and dates need parsing before anything can be counted or plotted.
The idea was to let a large language model do the reading: assign each narrative to one of the aviation occurrence categories the NTSB and ICAO already use, then apply ordinary data-visualization tools to the result so that patterns across category, time and place become visible.
Method
The 27 reports were exported from the NTSB database [4] and processed with Python scripts [5]. Each report's probable-cause narrative was sent to GPT-4 through the OpenAI API [6] with the NTSB occurrence-category definitions [7], and the model returned the matching category. The classification was then checked by hand.
The pipeline used Python 3 [8] with pandas [9], NumPy [10], joblib [11] for parallel processing, chardet [12] for detecting the encoding of the input files, Unidecode [13] to normalize the text, and matplotlib [14], seaborn [15] and folium [16] for the charts and the map. Error handling and logging were built in so that a failed API call or a malformed record did not silently corrupt the results. The scripts are open under an Apache 2.0 licence; see the code release.
What the data showed
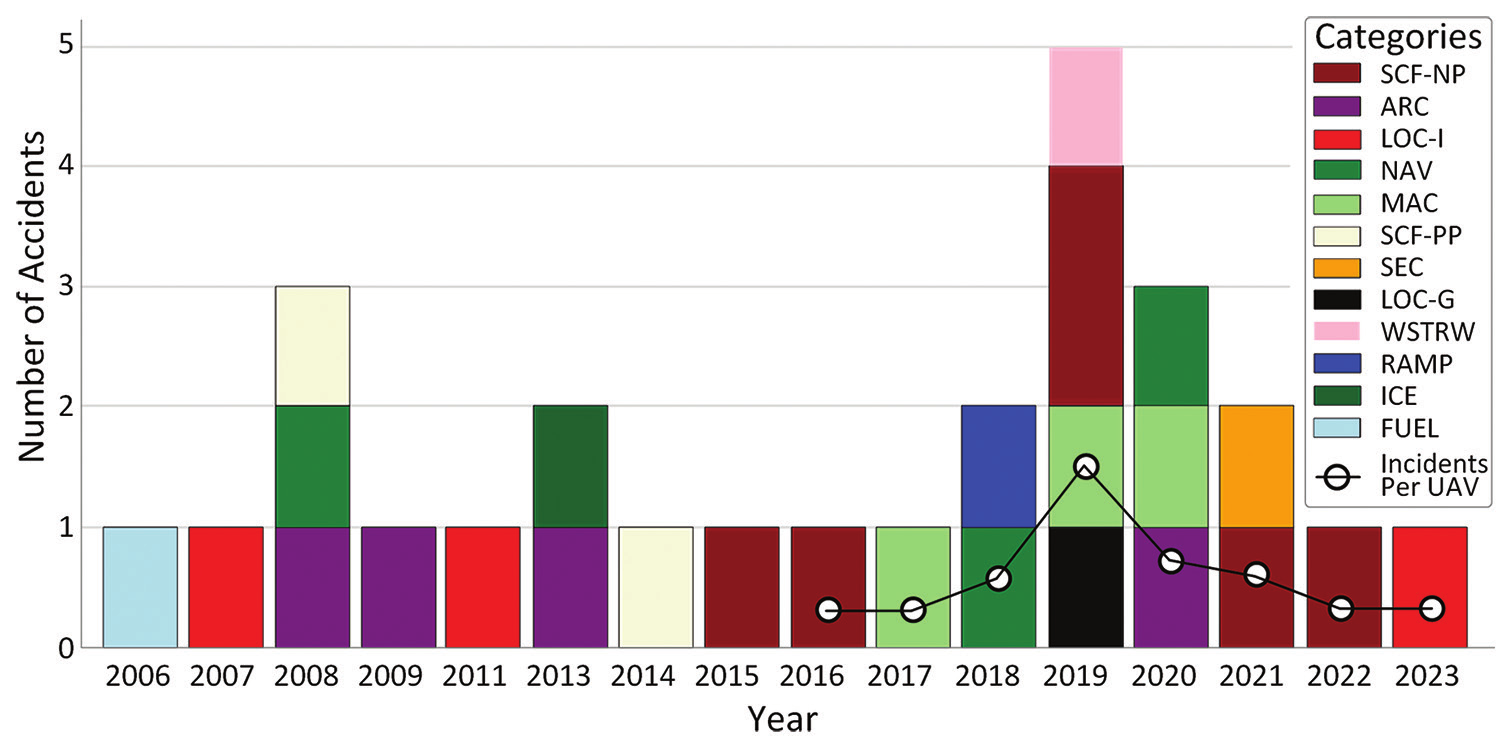
- The most frequent cause of unmanned-aircraft accidents in the set is system or component failure not related to the powerplant (SCF-NP), followed by abnormal runway contact (ARC).
- Accidents are geographically widespread across the United States, with a few local clusters; the interactive map shows every report at its reported location.
- There is a seasonal pattern, with spikes in May and August, and variation across years, with a notable peak in 2019.
- Normalized by the number of registered UAVs [2], [17]–[22], the accident rate trends downward after 2019, which suggests improving safety as the fleet grows.
The poster proposed three directions for further work: deep-learning techniques to analyze more complex accident data, natural-language processing to extract more from the narratives, and machine-learning classifiers such as decision trees or support vector machines to classify and predict accident scenarios from historical data.
What came next
The project became a peer-reviewed paper with Joao S. D. Garcia, published in the International Journal of AI for Materials and Design in February 2025 (DOI: 10.36922/ijamd.8544, full text PDF). The paper extends the method and the discussion of what the categories mean for UAS safety policy.
The map from the poster is now an interactive page where each of the 27 reports can be filtered by category and year. The classification scripts and the registered-fleet figures used for normalization are open on this site's datasets and code page (scripts, US UAV fleet 2016–2022). For what the findings mean for people building and certifying unmanned aircraft, see the guide on airworthiness security for eVTOL and UAS.
Acknowledgements
I am grateful for the support and guidance of the COMPASS Research Mentoring Program at Embry-Riddle Aeronautical University, and to Dr. Emily Faulconer for her continuous and insightful feedback throughout the project.
References
- FAA, "FAA Aerospace Forecast 2023–2043," 2023. faa.gov
- FAA, "FAA Aerospace Forecast 2017–2037," TC17-0002, 2017. rosap.ntl.bts.gov
- J. Ferrigan, "Safety risk assessment for UAV operation," Federal Aviation Administration, Apr. 2022. regulations.gov
- National Transportation Safety Board, "NTSB Aviation Investigation Search," accessed Jan. 11, 2024. ntsb.gov
- E. Pik, "GPT-4 assisted categorization and visualization of NTSB UAV accident reports," Python scripts, Jan. 2024. GitHub · DOI: 10.5281/zenodo.10576209
- OpenAI, "OpenAI Platform – API reference," accessed Jan. 11, 2024. platform.openai.com
- National Transportation Safety Board, "Aviation occurrence categories: definitions and usage notes." ntsb.gov (PDF)
- G. van Rossum and F. L. Drake, "The Python Language Reference." docs.python.org
- The pandas development team, "pandas-dev/pandas: Pandas," Zenodo, Dec. 2023. DOI: 10.5281/zenodo.3509134
- C. R. Harris et al., "Array programming with NumPy," Nature, vol. 585, pp. 357–362, 2020. DOI: 10.1038/s41586-020-2649-2
- Joblib Development Team, "Joblib: running Python functions as pipeline jobs," 2020. joblib.readthedocs.io
- M. Pilgrim, "chardet: Universal encoding detector for Python 3," 2023. pypi.org
- T. Solc, "Unidecode: ASCII transliterations of Unicode text," 2024. pypi.org
- T. A. Caswell et al., "matplotlib/matplotlib: REL: v3.5.1," Zenodo, Dec. 2021. DOI: 10.5281/zenodo.5773480
- M. Waskom, "seaborn: statistical data visualization," Zenodo, Mar. 2021. DOI: 10.5281/zenodo.4645478
- Filipe et al., "python-visualization/folium: v0.15.1," Zenodo, Dec. 2023. DOI: 10.5281/zenodo.10255171
- FAA, "FAA Aerospace Forecast 2016–2036," TC16-0002, 2016. rosap.ntl.bts.gov
- FAA, "FAA Aerospace Forecast 2018–2038," 2018. faa.gov (PDF)
- FAA, "FAA Aerospace Forecast 2019–2039," 2019. faa.gov (PDF)
- FAA, "FAA Aerospace Forecast 2020–2040," 2020. faa.gov (PDF)
- FAA, "FAA Aerospace Forecast 2021–2041," 2021. faa.gov (PDF)
- FAA, "FAA Aerospace Forecast 2022–2042," 2022. faa.gov (PDF)